Fig4TeX : A few commented examples

| Introduction | Reference Guide | Tutorial | Examples | Pdf Documentation |

Some basic informations are also available on this page.

Summary

NOTA:
The following examples are ready to use with plain TeX. With LaTeX, just copy-paste the text of the programs (except the last line \bye) between \begin{document} and \end{document}. The first line \input fig4tex.tex can also be omitted if the \usepackage{fig4tex} command is in the header of the document, as shown on this page (Insertion of a figure in a document).

A First Look

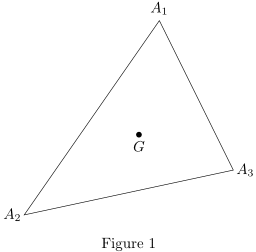
\input fig4tex.tex
%
% 1. Definition of characteristic points
\figinit{pt}
% Vertices of the triangle
\figpt 1:(80.5, 120)
\figpt 2:(-10, -10)
\figpt 3:(130, 20)
% and the barycenter
\figptbary 5:c.g.[1,2,3 ; 1,1,1]
%
% 2. Creation of the graphical file
\figdrawbegin{}
% A closed line to draw the triangle
\figdrawline[1,2,3,1]
\figdrawend
%
% 3. Writing text on the figure
\figvisu{\figBoxA}{Figure 1}
{
\figwriten 1:(4)
\figwritew 2:(2)
\figwritee 3:(2)
\figset write(mark=$\bullet$)
\figwrites 5:$G$(4)
}
\centerline{\box\figBoxA}
\bye

0. The first line loads the macro package. This statement needs to appear only once in the document.

Fig4TeX uses a colon (character :) as well as other punctuation marks as argument separators in macros (e.g.\figpt above). In case those characters should be redefined (for some kinds of typography, French for instance), those (re)definitions should be made before this '\input' line in the TeX document.

1. Definition of the three vertices of the triangle.
The system is first initialized and the unit to be used for the coordinates is set to pt (TeX point).
Each point is assigned a number, the value of which is chosen by the user. The text $A_i$ is implicitly associated with point number i.
Point 5 is then defined as the barycenter of the 3 vertices (\figptbary), with c.g. as associated text.

2. Creation of the graphical file that will contain the figure, here the three edges of the triangle, drawn as a single closed broken line. Here, the name of the file is internally handled by the macro package.

3. Writing text or comments on the figure.
The macro \figvisu builds a box whose name is given as an argument (\figBoxA here), as well as the caption that will appear below the figure. The box \figBoxA is preallocated in the macro package.
The last argument consists of a set of commands that deal with the appearance of the text on the figure. The figure is stored in the graphical file created just before, and is automatically included and "put" into the box.
The text associated with each point is printed at the location chosen by the user, i.e. at 4pt towards the north for point 1, at 2pt towards the west for point 2, at 2pt towards the east for point 3, at 4pt towards the south for point 5. Note that the text associated with point 5 is modified at this level ($G$). By default, the attached point of the text is not marked. However, for point 5, it is highlighted with a TeX symbol ($\bullet$) located right at the centroid of the triangle.

Finally (don't forget to) show the box (command '\box'). Here, the box is centered in the page.

Nota. Generally, only one box is needed in a whole document since the box can be reused several times. Three boxes, \figBoxA, \figBoxB and \figBoxC, are already allocated in the macro package and are available to the user, because several boxes may be necessary to display several figures side by side (see the description of the macro \figvisu in the section Writing text on the figure in the PDF documentation).


A Second One

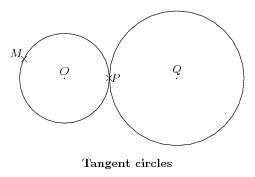
\input fig4tex.tex
%
\figinit{0.5in}
% 1. Characteristic points
\figpt 1:$O$(0,0)
\figpt 2:$M$(-0.9354, 0.45467)
%Compute distance between O and M
\figget distance=\DistOM[1,2]
%Define translation vector
\figvectC 10(\DistOM,0)
%Define translated points
\figpttra 3:$P$=1/1,10/
\figpttra 4:$Q$=3/1.5,10/
%
% 2. Creation of the graphical file
\figdrawbegin{}
\figdrawcirc 1(\DistOM)
\figget distance=\DistPQ[3,4]
\figdrawcirc 4(\DistPQ)
\figdrawend
%
% 3. Writing text on the figure
\figvisu{\figBoxA}{\bf Tangent circles}
{
\figset write(mark=$\times$)
\figwritenw 2:(0.04)\figwritee 3:(0.04)
\figset write(mark=.)
\figwriten 1:(0.08)\figwriten 4:(0.08)
}
\centerline{\box\figBoxA}
\bye

1. The unit length is set to 0.5 inch. Point 1 ($0$) is the origin, point 2 ($M$) is 'arbitrary'.
Get the distance (\figget distance) between those points, 'call' it \DistOM, define vector (number) 10 parallel to the x-axis, of length \DistOM, giving its components (\figvectC), define points 3 ($P$) and 4 ($Q$) as images of point 1 ($0$) by two translations (\figpttra) along the x-axis.

2. Initialize a new graphical file and then 'draw' the circle, centered at point 1 of radius \DistOM, compute distance between P and Q, then 'draw' the circle, centered at point 4 of radius \DistPQ.

3. Fill the box \figBoxA with the drawing (the graphical file is automatically inserted) and its legend: annotate the figure with x mark (\figset write) at point 2 ($M$) and 3 ($P$) ; change mark to a dot (.), then write text associated with points 1 and 4.

Finally show the box.


Arrows

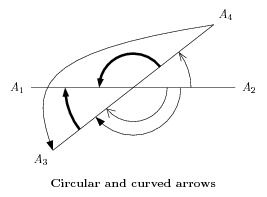
\input fig4tex.tex
%
% 1. Definition of characteristic points
\figinit{cm}
\def\rotangle{38}
\figpt 1:(-3,0)\figpt 2:(3,0)\figpt 0:(0,0)
\figptsrot 3=1,2/0,\rotangle/\figpt 5:(-3,1)
% 2. Creation of the graphical file
\figdrawbegin{}
\figdrawline[1,2]\figdrawline[3,4]
\figdrawarrowcirc 0;1.7(0,\rotangle)
\figset arrowhead(angle=30)
\figdrawarrowcircP 0;-1[2,3]
\figset arrowhead(angle=default,fillmode=yes)
\figset(width=2)
\figdrawarrowcircP 0;1[4,1]\figdrawarrowcircP 0;-2[3,1]
\figset(width=default)\figset arrowhead(length=0.3)
\figdrawarrowcircP 0;-1.4[2,3]\figdrawarrowBezier[4,5,1,3]
\figdrawend
% 3. Writing text on the figure
\figvisu{\figBoxA}{\bf Circular and curved arrows}{
\figwritew 1:(0.2)\figwritee 2:(0.2)
\figwritesw 3:(0.2)\figwritene 4:(0.2)}
%
\centerline{\box\figBoxA}
\bye
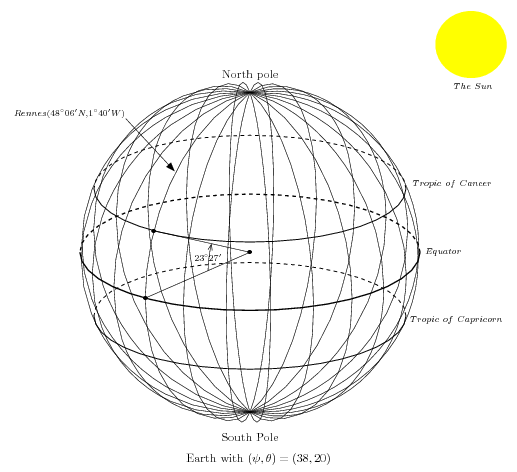

A 3D cube

\input fig4tex.tex
%
% 0. Initialization of variables (macros)
\def\Obdist{5000}\def\Valpsi{-68}\def\Valtheta{15} % Setting 3D parameters
%
\figinit{pt,realistic}
% Setting view angles for 'realistic' projection and observation distance
\figset projection(longitude=\Valpsi, latitude=\Valtheta, distance=\Obdist)
% 1. Characteristic points
\def\dist{280} % Edge length
\figpt 1:(0,0) % Defining 1 point
\figpttraC 2:=1/\dist,0,0/ % 3D translations in 'z=0' plane
\figpttraC 3:=1/\dist,\dist,0/
\figpttraC 4:=1/0,\dist,0/
\figvectC 10(0,0,\dist)\figptstra 5=1,2,3,4/1,10/ % 3D vertical translations
\figptbary21:[1,2,6,5;1,1,1,1] % Barycenters of faces
\figptbary22:[2,3,7,6;1,1,1,1]
\figptbary23:[5,6,7,8;1,1,1,1]
\figptbary24:[3,4,8,7;1,1,1,1]
\figptbary25:[4,1,5,8;1,1,1,1]
\figptbary26:[1,2,3,4;1,1,1,1]
% 2. Creation of the graphical file
\figdrawbegin{}
\figset (width=2)\figdrawline[1,2,6,5,1] % Drawing the edges of the cube
\figset (width=.4)\figdrawline[3,7,8]
\figset (dash=4)\figdrawline[3,4,8]
\figset (width=1)\figdrawline[1,4]
\figset (dash=1)\figdrawline[2,3]\figdrawline[5,8]\figdrawline[6,7]
\figset (dash=3)
% Drawing dashed circles on faces
\figset (width=1.2)\figdrawcirc21,1,2(50)
\figset (width=0.8)\figdrawcirc22,2,3(60) % with different width
\figset (width=1.2)\figdrawcirc23,5,6(60)
\figset (width=0.4)\figdrawcirc24,3,4(50)
\figset (width=0.6)\figdrawcirc25,4,1(60)
\figset (width=0.8)\figdrawcirc26,1,2(60)
\figdrawend
% 3. Writing text on the figure
\def\dist{3pt}
\figvisu{\figBoxA}{}{% An empty caption for the figure
\figset write(mark=$\figBullet$, ptname={{\bf#1}}) % Boldface numbers for vertices
\figwritesw 1:(\dist)\figwritese 2:(\dist)
\figwritee 3:(\dist)\figwritenw 4:(5pt)
\figwritenw 5:(\dist)\figwritese 6:(\dist)
\figwritene 7:(\dist)\figwritenw 8:(\dist)
\figset write(mark=)
% Comments for edges at middle point using "\boxit" macro, undefined here
% bold face for 'foreground' edges,
\figptbary 0:[2,6;1,1]\figwritew 0:\boxit{2pt}{\bf Ar\^ete 1}(1pt)
\figptbary 0:[7,6;1,1]\figwritese0:\boxit{2pt}{\bf Ar\^ete 2}(1pt)
\figptbary 0:[5,6;1,1]\figwritesw0:\boxit{2pt}{\bf Ar\^ete 3}(1pt)
% slanted for 'background' edges.
\figptbary 0:[4,8;1,1]\figwritee 0:\boxit{2pt}{\sl Ar\^ete 4}(1pt)
\figptbary 0:[4,1;1,1]\figwritenw0:\boxit{2pt}{Ar\^ete 5}(1pt)
\figptbary 0:[4,3;1,1]\figwritesw0:\boxit{2pt}{Ar\^ete 6}(1pt)
\figptbary 0:[1,5;1,1]\figwritew 0:\boxit{2pt}{\bf Ar\^ete 7}(1pt)
\figptbary 0:[3,2;1,1]\figwritese0:\boxit{2pt}{\bf Ar\^ete 8}(1pt)
\figptbary 0:[8,7;1,1]\figwritene0:\boxit{2pt}{\sl Ar\^ete 9}(1pt)
\figptbary 0:[3,7;1,1]\figwritee 0:\boxit{2pt}{Ar\^ete 10}(1pt)
\figptbary 0:[8,5;1,1]\figwritenw0:\boxit{2pt}{\bf Ar\^ete 11}(1pt)
\figptbary 0:[1,2;1,1]\figwritesw0:\boxit{2pt}{\bf Ar\^ete 12}(1pt)
% Comments for faces at barycenter of each face
% boldface for 'foreground' faces 1,2,3
\figwritec[21]{\bf Face 1}\figwritec[22]{\bf Face 2}
\figwritec[23]{\bf Face 3}\figwritec[24]{Face 4}
\figwritec[25]{Face 5}\figwritec[26]{Face 6}
}
\par\centerline{\box\figBoxA}
\bye


The Earth with equator, tropic lines and meridians

\input fig4tex.tex

% 1. Definition of characteristic points
\figinit{5cm,orthogonal}
% \Valpsi is here a count register to be used in "\advance" computation of angles
% to get the approximate limits between solid and dashed parallels
\newcount\Valpsi\Valpsi=38\def\Valtheta{20}
% Latitude of tropic lines is 23deg 27' N and S
\def\latitropic{23.45}
\def\sintropic{0.39795}\def\costropic{0.91741}
% Earth radius is set to 1
\def\R{1}\def\Rsun{0.21} % for the show !
\figpt 1:(0,0)\figpt 2:(\R,0)\figpt 3:North pole(0,0,\R)\figpt 0:(0,\R)
\figpt 4:(0,0,\sintropic)\figpt 5:(\costropic,0,\sintropic)
\figpt 6:(0,\costropic,\sintropic)\figpt 7:(0,0,-\sintropic)
\figpt 8:(\costropic,0,-\sintropic)\figpt 9:(0,\costropic,-\sintropic)
\figvectC 20(0,0,1)\figptcopy 11:/2/ % starting point for the meridian loop
\figvectC 21(0,-1,0) % rotation vector for angle of tropic
\figpt30:(0,1.3,1.3)\figptrot 30:=30/1,\the\Valpsi,20/ % center of the sun
% Rennes : 48deg 06' 53"N, 1deg 40' 46" W (just off Greenwich meridian)
\figpt 40:Rennes(0.706,-0.01,0.7071)\figpthom 41:=40/1,1.65/
% Setting view angles
\figset projection(longitude=\the\Valpsi, latitude=\Valtheta)
%
% 2. Creation of the graphical file
\figdrawbegin{}
% 12 meridians drawn in a 12-step loop
\newcount\meridians\meridians=12
\loop\ifnum\meridians>0\figdrawcirc 1,11,3(\R)\figptrot 11:=11/1,15,20/
\advance\meridians-1\repeat
% Tropic lines, solid in the foreground, dashed in the background
\newcount\angleone\angleone=-90\advance\angleone by\Valpsi
\newcount\angletwo\angletwo=90\advance\angletwo by\Valpsi
\figset (width=.7)
\figdrawarccirc 4,5,6;\costropic(\the\angleone,\the\angletwo)
\figdrawarccirc 7,8,9;\costropic(\the\angleone,\the\angletwo)
\advance\angleone by360
\figset (dash=8)
\figdrawarccirc 4,5,6;\costropic(\the\angletwo,\the\angleone)
\figdrawarccirc 7,8,9;\costropic(\the\angletwo,\the\angleone)
% Equator, thicker and solid in the foreground, dashed in the background
\newcount\angleone\angleone=-90\advance\angleone by\Valpsi
\figset (dash=default, width=1)
\figdrawarccirc 1,2,0;\R(\the\angleone,\the\angletwo)
\advance\angleone by360
\figset (dash=8)\figdrawarccirc 1,2,0;\R(\the\angletwo,\the\angleone)
\figreset {general}
% An arrow to Rennes
\figset arrowhead(fillmode=yes)\figdrawarrow[41,40]
\figptrot 13:=2/1,\latitropic,21/\figdrawline[13,1,2]
\figset arrowhead(fillmode=no, length=0.04)
\figptshom14=2,13/1,0.4/\figdrawarrowcirc 1,14,15;0.4(0,\latitropic)
% A circle in the projection plane will be the sun
\figset (color=\Yellowrgb, fillmode=yes)\figdrawcirc 30,1,3(\Rsun)
\figdrawend
%
% 3. Writing text on the figure
\figptrot 13:=2/1,\latitropic,21/\figptshom14=2,13/1,0.4/% in case not in update mode
%
\figvisu{\figBoxA}{Earth with $(\psi, \theta)=(\the\Valpsi, \Valtheta)$}{
\figwriten 3:(10pt)\figpt3:(0,0,-\R)\figwrites 3:South Pole(17pt)
\figptbary 4:[14,15;1,1]\figwritew 4:$\scriptstyle23^\circ27'$(-10pt)
%
\figptrot 11:=2/1,\latitropic,21/
\figwritenw41: $\scriptstyle {Rennes (48^\circ 06' N, 1^\circ 40' W)}$(1pt)
\figwrites30: $\scriptstyle {The\ Sun}$(.23)
\figwrites30: \kern-35pt$\scriptstyle {Tropic\ of\ Cancer}$(.80)
\figwrites30: \kern-50pt$\scriptstyle {Equator}$(1.20)
\figwrites30: \kern-28pt$\scriptstyle {Tropic\ of\ Capricorn}$(1.6)
\figset write(mark=$\figBullet$)\figwritep[1,2,11]
}
\par\centerline{\box\figBoxA}
\bye

And now you just need to change \Valpsi to have the earth rotate around its axis.