 |
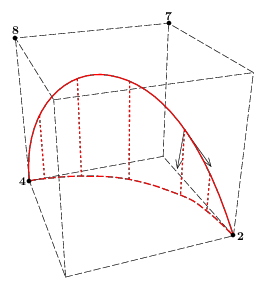
\input fig4tex.tex % % 1. Definition of characteristic points \figinit{5cm, rea} % Vertices of a cube \figpt 1:(0,0) \figpt 2:(1,0) \figpt 3:(1,1) \figpt 4:(0,1) \figptstraC 5=1,2,3,4/0,0,1/ % Center of the cube (target point) \figptbary 49:[2,8;1,1] % Points on a Bezier curve \figptBezier 31::0.2[4,8,7,2] \figptBezier 32::0.4[4,8,7,2] \figptBezier 33::0.6[4,8,7,2] \figptBezier 34::0.8[4,8,7,2] \figptBezier 35::0.9[4,8,7,2] % Derivatives at some point \def\numpt{34}\def\tb{0.8} \figvectDBezier 21:1,\tb[4,8,7,2]\figpttra 25:=\numpt/0.1,21/ \figvectDBezier 22:2,\tb[4,8,7,2]\figpttra 26:=\numpt/0.03,22/ % Projection of these points on the plane xOy \figvectC 10(0,0,1) \figptsorthoprojplane 11=31,32,33,34,35/1,10/ % % 2. Creation of the graphical file \figset projection(targetpt=49, distance=3) \figset projection(longitude=-110, latitude=27) \figdrawbegin{} % Cube \figset (color=default, dash=2) \figdrawline[1,2,3,4,1] \figdrawline[5,6,7,8,5] \figdrawline[1,5]\figdrawline[2,6]\figdrawline[3,7]\figdrawline[4,8] % Derivatives \figset (dash=default) \figdrawarrow[\numpt,25]\figdrawarrow[\numpt,26] % Bezier curve \figset (color=\Redrgb, width=1) \figdrawBezier1[4,8,7,2] % Projection on the plane xOy % 1. points \figset (dash=4) \figdrawline[31,11]\figdrawline[32,12] \figdrawline[33,13]\figdrawline[34,14]\figdrawline[35,15] % 2. curve \figset (dash=2) \figdrawcurve[4,4,11,12,13,14,15,2,2] \figdrawend % % 3. Writing text on the figure \def\dist{3pt} \figvisu{\figBoxA}{}{% %\figshowpts[1,8] % Show the vertices of the control polygon of the Bezier curve \figset write(mark={$\bullet$})\figset write(ptname={\bf #1}) \figwritew 4:(\dist) \figwriten 8,7:(\dist) \figwritee 2:(\dist) } \centerline{\box\figBoxA} % \bye |