 |
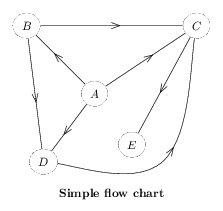
% 1. Definition of characteristic points \figinit{cm} % Node locations \figpt 1:$A$(0,0)\figpt 2:$B$(-2,2)\figpt 3:$C$(3,2) \figpt 4:$D$(-1.5,-2)\figpt 5:$E$(1.1,-1.5) % Additional point to define the curved path \figpt 0:(2,-2) % % 2. Creation of the graphical file \figdrawbegin{} % Draw the connections between nodes \figdrawfcconnect[1,2]\figdrawfcconnect[1,3]\figdrawfcconnect[1,4] \figdrawfcconnect[2,3]\figdrawfcconnect[2,4] \figdrawfcconnect[3,5] \figset flowchart(line=curve)\figdrawfcconnect[4,0,3] % Draw the frames at each node \figset (color=1)\figset flowchart(shape=ellipse) \figdrawfcnode[1,2,3,4,5]{} \figdrawend % % 3. Writing text on the figure \figvisu{\figBoxA}{{\bf Simple flow chart}}{ \figwritec[1,2,3,4,5]{} } \centerline{\box\figBoxA} |