 |
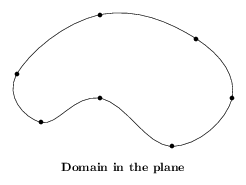
% 1. Definition of characteristic points (Interpolation points) \figinit{pt} \figpt 1:(-100, 20)\figpt 2:(-30, 70) \figpt 3:(50, 50)\figpt 4:(80,0) \figpt 5:(30, -40)\figpt 6:(-30, 0)\figpt 7:(-80, -20) % 2. Creation of the graphical file \figdrawbegin{} \figdrawcurve[1,2,3,4,5,6,7,1,2,3] \figdrawend % 3. Writing text on the figure \figvisu{\figBoxA}{\bf Domain in the plane}{ \figset write(mark=$\figBullet$) \figwritep[1,2,3,4,5,6,7] } \centerline{\box\figBoxA} |