 |
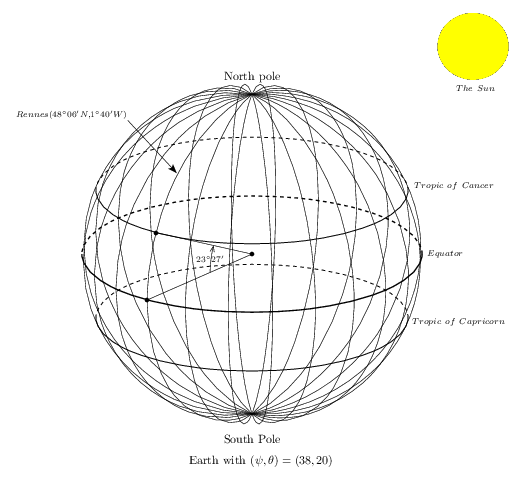
\input fig4tex.tex % 1. Definition of characteristic points \figinit{5cm,orthogonal} % \Valpsi is here a count register to be used in "\advance" computation of angles % to get the approximate limits between solid and dashed parallels \newcount\Valpsi\Valpsi=38\def\Valtheta{20} % Latitude of tropic lines is 23deg 27' N and S \def\latitropic{23.45} \def\sintropic{0.39795}\def\costropic{0.91741} % Earth radius is set to 1 \def\R{1}\def\Rsun{0.21} % for the show ! \figpt 1:(0,0)\figpt 2:(\R,0)\figpt 3:North pole(0,0,\R)\figpt 0:(0,\R) \figpt 4:(0,0,\sintropic)\figpt 5:(\costropic,0,\sintropic) \figpt 6:(0,\costropic,\sintropic)\figpt 7:(0,0,-\sintropic) \figpt 8:(\costropic,0,-\sintropic)\figpt 9:(0,\costropic,-\sintropic) \figvectC 20(0,0,1)\figptcopy 11:/2/ % starting point for the meridian loop \figvectC 21(0,-1,0) % rotation vector for angle of tropic \figpt30:(0,1.3,1.3)\figptrot 30:=30/1,\the\Valpsi,20/ % center of the sun % Rennes : 48deg 06' 53"N, 1deg 40' 46" W (just off Greenwich meridian) \figpt 40:Rennes(0.706,-0.01,0.7071)\figpthom 41:=40/1,1.65/ % Setting view angles \figset projection(longitude=\the\Valpsi, latitude=\Valtheta) % % 2. Creation of the graphical file \figdrawbegin{} % 12 meridians drawn in a 12-step loop \newcount\meridians\meridians=12 \loop\ifnum\meridians>0\figdrawcirc 1,11,3(\R)\figptrot 11:=11/1,15,20/ \advance\meridians-1\repeat % Tropic lines, solid in the foreground, dashed in the background \newcount\angleone\angleone=-90\advance\angleone by\Valpsi \newcount\angletwo\angletwo=90\advance\angletwo by\Valpsi \figset (width=.7) \figdrawarccirc 4,5,6;\costropic(\the\angleone,\the\angletwo) \figdrawarccirc 7,8,9;\costropic(\the\angleone,\the\angletwo) \advance\angleone by360 \figset (dash=8) \figdrawarccirc 4,5,6;\costropic(\the\angletwo,\the\angleone) \figdrawarccirc 7,8,9;\costropic(\the\angletwo,\the\angleone) % Equator, thicker and solid in the foreground, dashed in the background \newcount\angleone\angleone=-90\advance\angleone by\Valpsi \figset (dash=default, width=1) \figdrawarccirc 1,2,0;\R(\the\angleone,\the\angletwo) \advance\angleone by360 \figset (dash=8)\figdrawarccirc 1,2,0;\R(\the\angletwo,\the\angleone) \figreset {general} % An arrow to Rennes \figset arrowhead(fillmode=yes)\figdrawarrow[41,40] \figptrot 13:=2/1,\latitropic,21/\figdrawline[13,1,2] \figset arrowhead(fillmode=no, length=0.04) \figptshom14=2,13/1,0.4/\figdrawarrowcirc 1,14,15;0.4(0,\latitropic) % A circle in the projection plane will be the sun \figset (color=\Yellowrgb, fillmode=yes)\figdrawcirc 30,1,3(\Rsun) \figdrawend % % 3. Writing text on the figure \figptrot 13:=2/1,\latitropic,21/\figptshom14=2,13/1,0.4/% in case not in update mode % \figvisu{\figBoxA}{Earth with $(\psi, \theta)=(\the\Valpsi, \Valtheta)$}{ \figwriten 3:(10pt)\figpt3:(0,0,-\R)\figwrites 3:South Pole(17pt) \figptbary 4:[14,15;1,1]\figwritew 4:$\scriptstyle23^\circ27'$(-10pt) % \figptrot 11:=2/1,\latitropic,21/ \figwritenw41: $\scriptstyle {Rennes (48^\circ 06' N, 1^\circ 40' W)}$(1pt) \figwrites30: $\scriptstyle {The\ Sun}$(.23) \figwrites30: \kern-35pt$\scriptstyle {Tropic\ of\ Cancer}$(.80) \figwrites30: \kern-50pt$\scriptstyle {Equator}$(1.20) \figwrites30: \kern-28pt$\scriptstyle {Tropic\ of\ Capricorn}$(1.6) \figset write(mark=$\figBullet$)\figwritep[1,2,11] } \par\centerline{\box\figBoxA} \bye |