 |
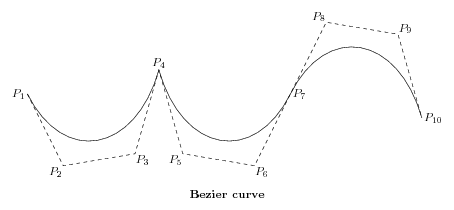
% 1. Definition of characteristic points \figinit{pt} \figpt 1:(-30,-10)\figpt 2:(0,-70)\figpt 3:(60,-60)\figpt 4:(80,10) \figpt 0:(80,100) % Only used to define the line (0,4) for the symmetry \figptssym 5=3,2,1/0,4/\figptsrot 8=6,5,4/7,180/ % 2. Creation of the graphical file \psbeginfig{} \psBezier 3[1,2,3,4,5,6,7,8,9,10] \psset(dash=8)\psline[1,2,3,4,5,6,7,8,9,10] \psendfig % 3. Writing text on the figure \figvisu{\figBoxA}{\bf Bezier curve}{ \figsetptname{$P_{#1}$} \figwritew 1:(2)\figwritesw 2,5:(1)\figwritese 3,6:(1)\figwriten 4:(2) \figwritee 7,10:(2)\figwritenw 8:(1)\figwritene 9:(1) } \centerline{\box\figBoxA} |