 |
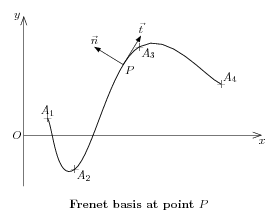
% 1. Definition of characteristic points \figinit{cm} \def\ORIG{0} \figpt \ORIG:$O$(0, 0) \figpt 1:(0.7,0.5)\figpt 2:(1.5,-1) \figpt 3:(3.4,2.6)\figpt 4:(5.8,1.5) \def\Xone{0}\def\Xtwo{7}\def\Yone{-1.5}\def\Ytwo{3.5} % 2. Creation of the graphical file \psbeginfig{} % Draw the axes and the curve that interpolates the data points \psaxes \ORIG(\Xone,\Xtwo, \Yone,\Ytwo) \psset (width=0.6)\pscurve [1,1,2,3,4,4]\psset (width=\defaultwidth) % Compute the control points of the smooth curve \figptscontrolcurve 11, \NbArcs [1,1,2,3,4,4] % Compute a point lying on the second arc of the curve (between A2 and A3) \def\PointName{$P$} \def\Valt{0.8}\figptBezier 25 :\PointName: \Valt [14,15,16,17] % Compute and normalize the tangent vector at this point \figvectDBezier 21 : 1, \Valt [14,15,16,17]\figvectU 21[21] % Draw the tangent and normal vectors \psset arrowhead(length=0.2,fillmode=yes) \figpttra 26:$\vec{t}$=25/1,21/\psarrow [25,26] \figvectNV 22[21]\figpttra 27:$\vec{n}$=25/1,22/\psarrow [25,27] \psendfig % 3. Writing text on the figure \figvisu{\figBoxA}{\bf Frenet basis at point \PointName}{ % Write the name of the points \figsetmark{$+$}\figwriten 1:(2pt)\figwritese 2,3:(2pt)\figwritene 4:(2pt) \figsetmark{}\figwritew \ORIG:(2pt)\figwritese 25:(2pt) % Write the name of the 2 vectors \figwriten 26,27:(2pt) % Compute the end points of the axes and write the associated text \figptsaxes 1:\ORIG(\Xone,\Xtwo, \Yone,\Ytwo) \figwrites 1:(3pt) \figwritew 2:(3pt) } \centerline{\box\figBoxA} |