 |
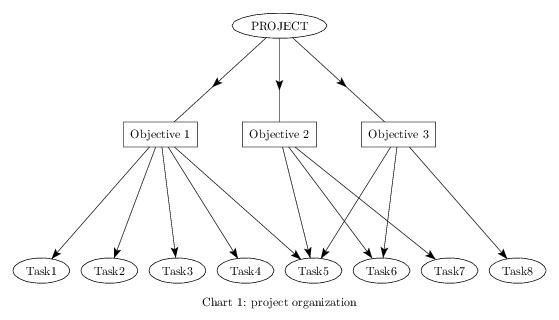
% 1. Definition of characteristic points \figinit{cm} \figvectC 0(2,0) \figset write(ptname=Task#1) \figpt 1:(0,0)\figptstra 2=1,2,3,4,5,6,7/1,0/ % Niveau 0 \figptbary 11:[1,8 ; 75,25] \figptbary 12:[1,8 ; 1,1] \figptbary 13:[1,8 ; 25,75] \figvectC 0(0,4)\figpttra 11:Objective 1=11/1,0 / % Niveau 1 \figpttra 12:Objective 2=12/1,0 /\figpttra 13:Objective 3=13/1,0 / \figpttra 21:PROJECT=12/0.8,0/ % Niveau 2 % 2. Creation of the graphical file \figdrawbegin{} %\figshowsettings \figset arrowhead(fill=y,length=0.32) \figdrawfcconnect[21,11]\figdrawfcconnect[21,12]\figdrawfcconnect[21,13] \figset flowchart(arrowr=end) \figset flowchart(arrowpos=0.91)\figdrawfcconnect[11,1] \figset flowchart(arrowpos=0.907)\figdrawfcconnect[11,2] \figset flowchart(arrowpos=0.9038)\figdrawfcconnect[11,3] \figset flowchart(arrowpos=0.91)\figdrawfcconnect[11,4] \figset flowchart(arrowpos=0.915)\figdrawfcconnect[11,5] \figset flowchart(arrowpos=0.905)\figdrawfcconnect[12,5] \figset flowchart(arrowpos=0.9086)\figdrawfcconnect[12,6] \figset flowchart(arrowpos=0.9176)\figdrawfcconnect[12,7] \figset flowchart(arrowpos=0.91)\figdrawfcconnect[13,5] \figset flowchart(arrowpos=0.9038)\figdrawfcconnect[13,6] \figset flowchart(arrowpos=0.91)\figdrawfcconnect[13,8] % \figdrawfcnode[11,12,13]{} \figset flowchart(shape=e) \figdrawfcnode[1,2,3,4,5,6,7,8,21]{} \figdrawend % 3. Writing text on the figure \figvisu{\figBoxA}{Chart 1: project organization}{% \figwritec[11,12,13]{} \figwritec[1,2,3,4,5,6,7,8,21]{} } \centerline{\box\figBoxA} |