 |
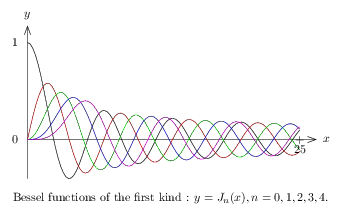
\input fig4tex \def\GraphLegend{Bessel functions of the first kind : $y = J_n(x), n = 0, 1, 2, 3, 4.$} % 1. Definition of characteristic points \figinit{mm} \def\Xmin{0} \def\Ymin{-11.47688} \def\Xmax{80.00000} \def\Ymax{28.52311} \def\Xori{0} \def\Yori{11.47688} \figpt0:(\Xori,\Yori) % 2. Creation of the graphical file \figdrawbegin{} \def\Xmaxx{85} % To customize the position \def\Ymaxx{33.5} % of the arrow-heads of the axes. \figdrawaxes 0(\Xmin, \Xmaxx, \Ymin, \Ymaxx) % The coordinates of the points are in the files "ptsBesselnu" % nu = 0 \figset(color=\Blackrgb)\figdrawlineF{ptsBessel0} % nu = 1.00000 \figset(color=\Redrgb)\figdrawlineF{ptsBessel1} % nu = 2.00000 \figset(color=\Greenrgb)\figdrawlineF{ptsBessel2} % nu = 3.00000 \figset(color=\Bluergb)\figdrawlineF{ptsBessel3} % nu = 4.00000 \figset(color=\Magentargb)\figdrawlineF{ptsBessel4} \figdrawend % 3. Writing text on the figure \figvisu{\figBoxA}{\GraphLegend}{% \figptsaxes 1:0(\Xmin, \Xmaxx, \Ymin, \Ymaxx) % Points 1 and 2 are the end points of the arrows \figwritee 1:(5pt) \figwriten 2:(5pt) \figptsaxes 1:0(\Xmin, \Xmax, \Ymin, \Ymax) % Points 1 and 2 are the first two end points of the axes \figwritew 2:$1$(8pt) % Points 3 and 4 are the two other end points of the axes \figpttraC 3:=0/\Xmin,0/ \figwritew 3:$0$(8pt) \figpttraC 4:=0/0,\Ymin/ \figset write(mark=+)\figwrites 1:$25$(5pt) } \centerline{\box\figBoxA} \bye |